Managing a dynamic investment portfolio requires absolute precision to avoid catastrophic calculation errors. If you are looking for an intuitive average cost basis calculator to streamline your market entries, this real-time system is engineered to eliminate manual math vulnerabilities. By instantly consolidating multi-tier asset acquisitions, our tool isolates your exact blended entry price, allowing you to accurately establish risk parameters, optimize position sizing, and safeguard your net profit margins across stocks, crypto, forex, and inventory units.
Average Entry Calculator
Track your blended entry price across multiple add-on trades. See exactly when to close for profit.
Tip: Press Enter in the Price field to add the next trade automatically.
Table of Contents
Understanding Cost Basis in Modern Asset Management
When building an investment position over time, executing a single transaction is rare. Instead, professional market participants utilize multi-tiered entry strategies—scaling into positions via dollar-cost averaging (DCA) or tactical scale-ins. Every subsequent asset purchase alters your structural break-even threshold.
To track these changes, you must establish an accurate average cost basis calculator workflow.
Your cost basis represents the original value of an asset adjusted for stock splits, dividends, and transaction fees. It serves as the baseline benchmark that determines your taxable capital gains or losses upon asset liquidation. Miscalculating this metric can cause two critical errors:
- Triggers unexpected tax liabilities with regulatory authorities.
- Leads to premature trade exits due to an inaccurate perception of your actual break-even point.
The Mathematics Behind the Blended Entry Price
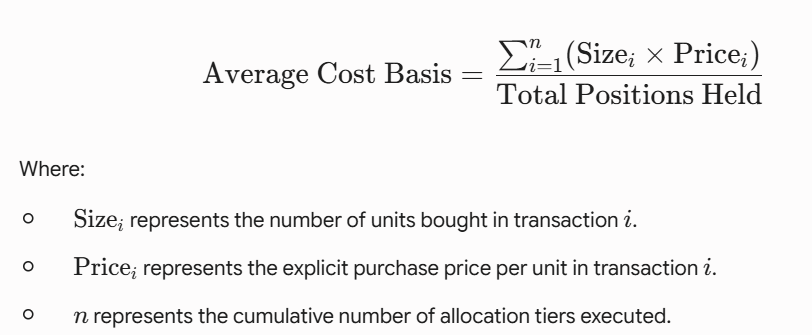
Calculating a simple arithmetic mean does not work for multi-tier investments unless every single trade size is perfectly identical. Instead, you must use a weighted average cost basis formula. This mathematical approach ensures that larger asset purchases carry proportionally higher weight over your final baseline entry price.
The mathematical model used by our automated system follows this formal equation:
Step-by-Step Manual Calculation Example
To better understand how our interactive tool computes these values instantly, let’s break down a typical three-tier asset scaling scenario manually:
- First Order: You buy 100 shares of an asset at $150 per share.$$\text{Total Outlay 1} = 100 \times 150 = \$15,000$$
- Second Order: The market retraces, and you buy an additional 150 shares at $130.$$\text{Total Outlay 2} = 150 \times 130 = \$19,500$$
- Third Order: A final momentum confirmation triggers a purchase of 50 shares at $160.$$\text{Total Outlay 3} = 50 \times 160 = \$8,000$$
To calculate the absolute blended entry price manually, combine the total capital deployed and divide it by the total accumulated unit size:
- Total Capital Deployed: $\$15,000 + \$19,500 + \$8,000 = \$42,500$
- Total Accumulated Units: $100 + 150 + 50 = 300 \text{ shares}$
- Final Cost Basis: $\frac{\$42,500}{300} = \$141.6667$
By keeping this baseline in view, you can easily see that even though your final purchase was executed at $160, your net break-even point sits comfortably at $141.67.
Why Human-Centric UI Beats Generic Tracking Spreadsheets
Many traders rely on static spreadsheet templates to calculate cost basis metrics. However, manual data entry often introduces formatting errors and broken formula ranges. Our dedicated calculation interface offers several key advantages:
- Asynchronous Processing: The platform processes computations instantly inside your browser engine. This approach eliminates latency issues and prevents the layout shifts common on poorly optimized finance sites.
- Bi-Directional Calculation Engine: The system handles both incoming scale-ins (Buys) and outgoing partial profit realizations (Sells) in a single linear timeline view. This mirrors the execution structure used by institutional portfolio software.
- Siloed Asset Parameters: You can quickly toggle between stocks, crypto tokens, and forex lot allocations. This adjustment alters the decimal limits and unit terminology automatically to match your specific asset class.
Tax Implications: FIFO vs. Specific Identification
It is crucial to note that while tracking an average cost basis provides an excellent reference for daily portfolio performance, tax authorities (such as the Internal Revenue Service) utilize distinct methodologies for capital gains tracking:
| Calculation Methodology | Operational Definition | Primary Use Case Profile |
| FIFO (First-In, First-Out) | Mandates that the earliest assets purchased are the first ones recognized as sold during a liquidation event. | Standard default reporting layout for most retail brokerage accounts. |
| LIFO (Last-In, First-Out) | Treats the newest asset additions as the first units sold during a liquidation phase. | Used tactically in specific corporate accounting structures to manage net income. |
| Average Cost Method | Divides the total cost of all shares available by the total number of shares owned. | Standard regulatory layout for mutual fund allocations and specific crypto tracking. |
Strategic Optimization: Navigating the Wash-Sale Trap
When using an average cost basis calculator to lower your average entry price on a declining asset, you must keep compliance rules in mind.
A common pitfall for retail market participants is the Wash-Sale Rule. If you sell an asset at a loss to harvest a tax deduction but buy a “substantially identical” asset within a 61-day window (30 days before or 30 days after the sale date), you cannot claim that tax loss immediately. Instead, the realized loss is added directly back into the cost basis of your new purchase.
Expert Optimization Note: If you deploy capital to average down an open position, verify that any partial exits do not accidentally trigger wash-sale parameters. Doing so can artificially inflate your cost basis and complicate your year-end reporting.